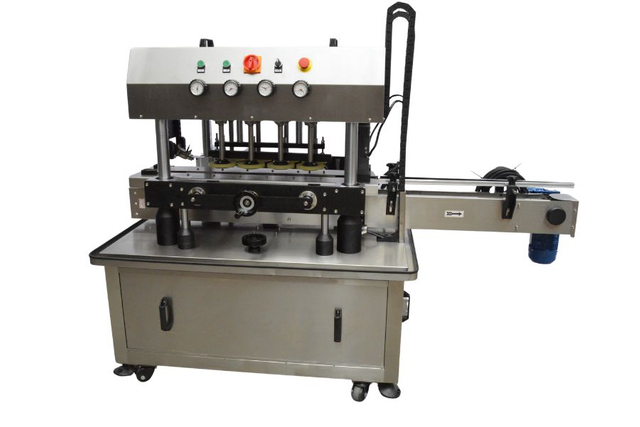
For many manufacturers, an automatic packaging machine can repay its installed cost in roughly 1.5–4 years when it replaces repetitive labor, reduces material loss, and raises usable output. A $300,000 installed system producing $120,000 in annual labor savings, $30,000 in material savings, and $20,000 in lower rejects, while adding $25,000 in annual maintenance and support costs, generates about $145,000 in annual net cash benefit and a 2.1-year simple payback. Plants operating two or three shifts usually have more opportunities to justify automation than low-volume, single-shift sites, because the same equipment investment is used for more production hours each year.
Return should first be measured against the full installed cost, not the machine invoice. A packaging machine quoted at $220,000 can require another $20,000–$80,000 for conveyors, electrical work, guarding, tooling, installation, commissioning, training, and initial spare parts. A project reaching $280,000 after installation therefore needs $140,000 of annual net savings to recover its cost in 2 years, while $70,000 extends simple payback to 4 years.
That cost base makes labor the first operating number worth checking. Assume a packaging area uses five operators per shift, two shifts per day, 250 days per year, with a fully loaded employment cost of $52,000 per operator. Annual labor expense reaches $520,000. If automation reduces staffing from five people to three per shift, the gross difference is about $208,000 per year before accounting for reassignment, overtime, supervision, and technical support.
Labor estimates need to reflect what actually happens after installation. Moving four employees to another production area is not the same as removing $208,000 from annual spending, although the reassignment may allow the factory to increase production without hiring four additional people. For a conservative 2026 capital model, management could count only 60%–80% of theoretical labor reduction until the post-installation staffing plan is documented.
A machine that removes 4,000 manual work hours annually at a loaded labor rate of $30 per hour creates $120,000 of gross labor capacity. If maintenance and technician costs rise by $25,000, the labor-related annual improvement falls to $95,000.
Once staffing has been measured, packaging materials deserve similar attention because a small percentage reduction can become a large annual number. A facility spending $1.2 million per year on film, pouches, cartons, caps, labels, and related materials saves $36,000 from a 3% reduction and $60,000 from a 5% reduction. Automated cutting, sealing, forming, and dispensing can improve repeatability when the existing process regularly uses excess material.
Material savings should be tested with production records rather than supplier claims. Take 100,000 packages from the current process and compare their average film length, package weight, seal rejects, and damaged-material rate with a controlled production run from the proposed machine. A reduction from 2.8% material scrap to 1.6% removes 1.2 percentage points of waste; on $800,000 of annual material purchases, that difference is $9,600 per year.
Filling accuracy can add another measurable amount. A 500 g food package averaging 505 g contains 5 g of extra product, equal to 1% of nominal weight. At 6 million packages per year, the additional product reaches 30,000 kg. With production cost at $2.50 per kg, the annual product amount represented by that 5 g average overfill is $75,000.
The actual saving will be smaller because a manufacturer still needs a suitable process margin around the declared quantity and must comply with applicable weights-and-measures requirements. If improved dosing reduces average fill from 505 g to 502 g rather than exactly 500 g, annual product use falls by 18,000 kg across 6 million packs. At $2.50 per kg, that is $45,000 per year.
Filling performance becomes especially relevant when a project includes filling and capping equipment. A buyer should compare fill accuracy, cap placement, torque repeatability, container handling, cleaning time, format-change time, and sustained containers per minute under its own product conditions. A line rated at 80 containers per minute but operating at 65% effective utilization averages only 52 containers per minute before considering saleable-pack quality.
That gap leads to throughput, another frequently overstated part of ROI. Consider a current line producing 30 good packs per minute for 16 scheduled hours per day and 250 days per year. At 80% effective runtime, annual output is about 5.76 million good packs. A new system producing 50 good packs per minute at the same 80% level reaches about 9.6 million, providing capacity for 3.84 million additional packs.
| Production measure | Existing line | Automatic line |
|---|---|---|
| Sustainable rate | 30 packs/min | 50 packs/min |
| Scheduled hours/year | 4,000 | 4,000 |
| Effective runtime | 80% | 80% |
| Good packs/year | 5.76 million | 9.60 million |
| Additional annual capacity | — | 3.84 million |
Capacity should not be entered as revenue unless the company can manufacture and sell the additional volume. If market demand supports only 1 million extra packs and each contributes $0.18 after variable production and distribution costs, annual contribution is $180,000, not the theoretical amount associated with all 3.84 million packs. Upstream mixing, processing, filling, and downstream case packing can reduce the usable increase further.
Rated speed describes equipment capability under specified conditions; annual financial performance depends on good units produced and sold. A 20% speed increase has little financial effect when the packaging line already has 30% unused capacity.
Reject reduction can then be added using the same conservative approach. Suppose a factory produces 8 million packages annually and packaging defects fall from 2.0% to 0.8% after automation. Reject volume falls from 160,000 to 64,000 packages, a reduction of 96,000. At $0.45 of product and packaging cost per rejected unit, the direct annual difference is $43,200 before rework labor and disposal expenses.
Downtime also belongs in the calculation, although only productive time with economic use should receive a dollar amount. If packaging-related stoppages total 300 hours per year and an automated system cuts them by 25%, 75 hours become available. At 2,400 good units per hour, that creates room for 180,000 additional units; at $0.20 contribution per saleable unit, the maximum annual contribution is $36,000 if demand and upstream supply are available.
Maintenance moves in the opposite direction. A manual packaging area may have limited equipment costs, while automation introduces sensors, motors, pneumatic components, belts, heaters, controls, tooling, and scheduled service. If preventive maintenance, wear parts, software, and technical support total $30,000 annually, that amount should be deducted every year rather than treated as a one-time expense. A 10-year equipment life can make neglected maintenance assumptions materially distort the project economics.
Energy is normally smaller than labor or materials but should still be measured for equipment running thousands of hours. A line drawing an average of 18 kW for 4,000 hours uses about 72,000 kWh annually. At $0.15 per kWh, electricity costs about $10,800. Compressed air, vacuum generation, heating, cooling, washdown, and auxiliary conveyors can add further operating expense depending on the packaging process.
A complete example shows how the numbers interact:
| Annual financial item | Amount |
|---|---|
| Labor reduction/redeployment | $135,000 |
| Material reduction | $42,000 |
| Lower product giveaway | $38,000 |
| Fewer rejects and less rework | $31,000 |
| Additional saleable production | $75,000 |
| Gross annual improvement | $321,000 |
| Added maintenance/support | -$32,000 |
| Added utilities | -$11,000 |
| Annual net cash improvement | $278,000 |
With an installed project cost of $620,000, $278,000 in annual net improvement gives a simple payback of approximately 2.23 years. Five years of unchanged net cash improvement totals $1.39 million; after subtracting the original $620,000 investment, the remaining cumulative amount is $770,000 before financing, tax, depreciation, inflation, and the time value of money.
A five-year view is more useful than a single-year percentage because equipment costs and savings occur at different times. At an 8% discount rate, $100,000 received five years from now has a present value of about $68,100. Large packaging projects should therefore be assessed with discounted cash flow and net present value alongside simple payback, particularly when comparing a lower-priced machine with higher operating costs against a more expensive system with lower annual labor and material consumption.
Sensitivity testing is equally useful because no production forecast is exact. For a $400,000 installation, annual net improvement of $100,000 produces a 4.0-year payback; $160,000 reduces it to 2.5 years; $220,000 reduces it to about 1.82 years. Management can then see how the project performs when labor savings, output, maintenance, or material reduction falls below the supplier's initial estimate.
| Scenario | Annual net improvement | Installed cost | Simple payback |
|---|---|---|---|
| Lower case | $100,000 | $400,000 | 4.00 years |
| Expected case | $160,000 | $400,000 | 2.50 years |
| Higher case | $220,000 | $400,000 | 1.82 years |
Changeovers can materially alter those scenarios in factories with many SKUs. A line making eight product changes per day and requiring 20 minutes per change spends 160 minutes changing formats. Cutting changeover time to 10 minutes releases 80 minutes per day. Across 250 production days, that equals about 333 hours of additional available production time per year, although cleaning and quality checks may still limit usable hours.
For that reason, equipment trials should reproduce normal production rather than a short run with one easy product. A useful acceptance test can include several container or package sizes, normal operators, actual materials, repeated start-stop cycles, and at least 3–5 representative SKUs. Measurements should include good packs per minute, reject percentage, changeover minutes, material consumption per 1,000 packs, and unplanned stops.
The strongest ROI estimate uses measured factory data instead of rated machine speed. Before approving capital expenditure, a manufacturer should have at least 12 months of production volume, labor hours, packaging-material spending, reject data, downtime records, SKU frequency, and maintenance costs. Comparing those records with documented machine-test results makes a 2-year payback claim far more credible than calculating it from brochure speed alone.
For many plants, a realistic return therefore comes from several moderate improvements rather than one large saving: 20%–40% lower direct packaging labor, 2%–5% lower material consumption in suitable applications, reduced overfill, fewer rejects, and more productive operating hours. A $300,000–$600,000 project can justify itself within several years when enough of those improvements occur together, while low-volume equipment running one shift may require a much longer period.